Data-Driven Admissions: What UCLA and Ivy+ Acceptance Rates Reveal About Your Odds
September 27, 2026

Quick Summary
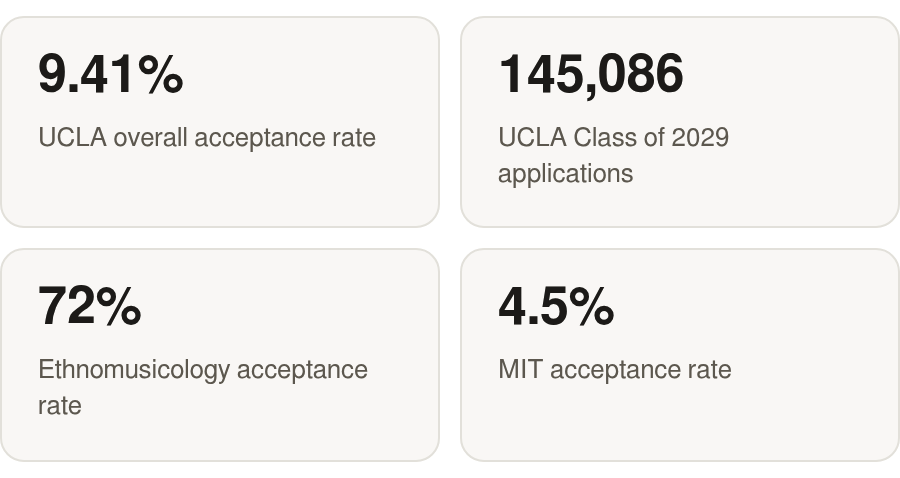
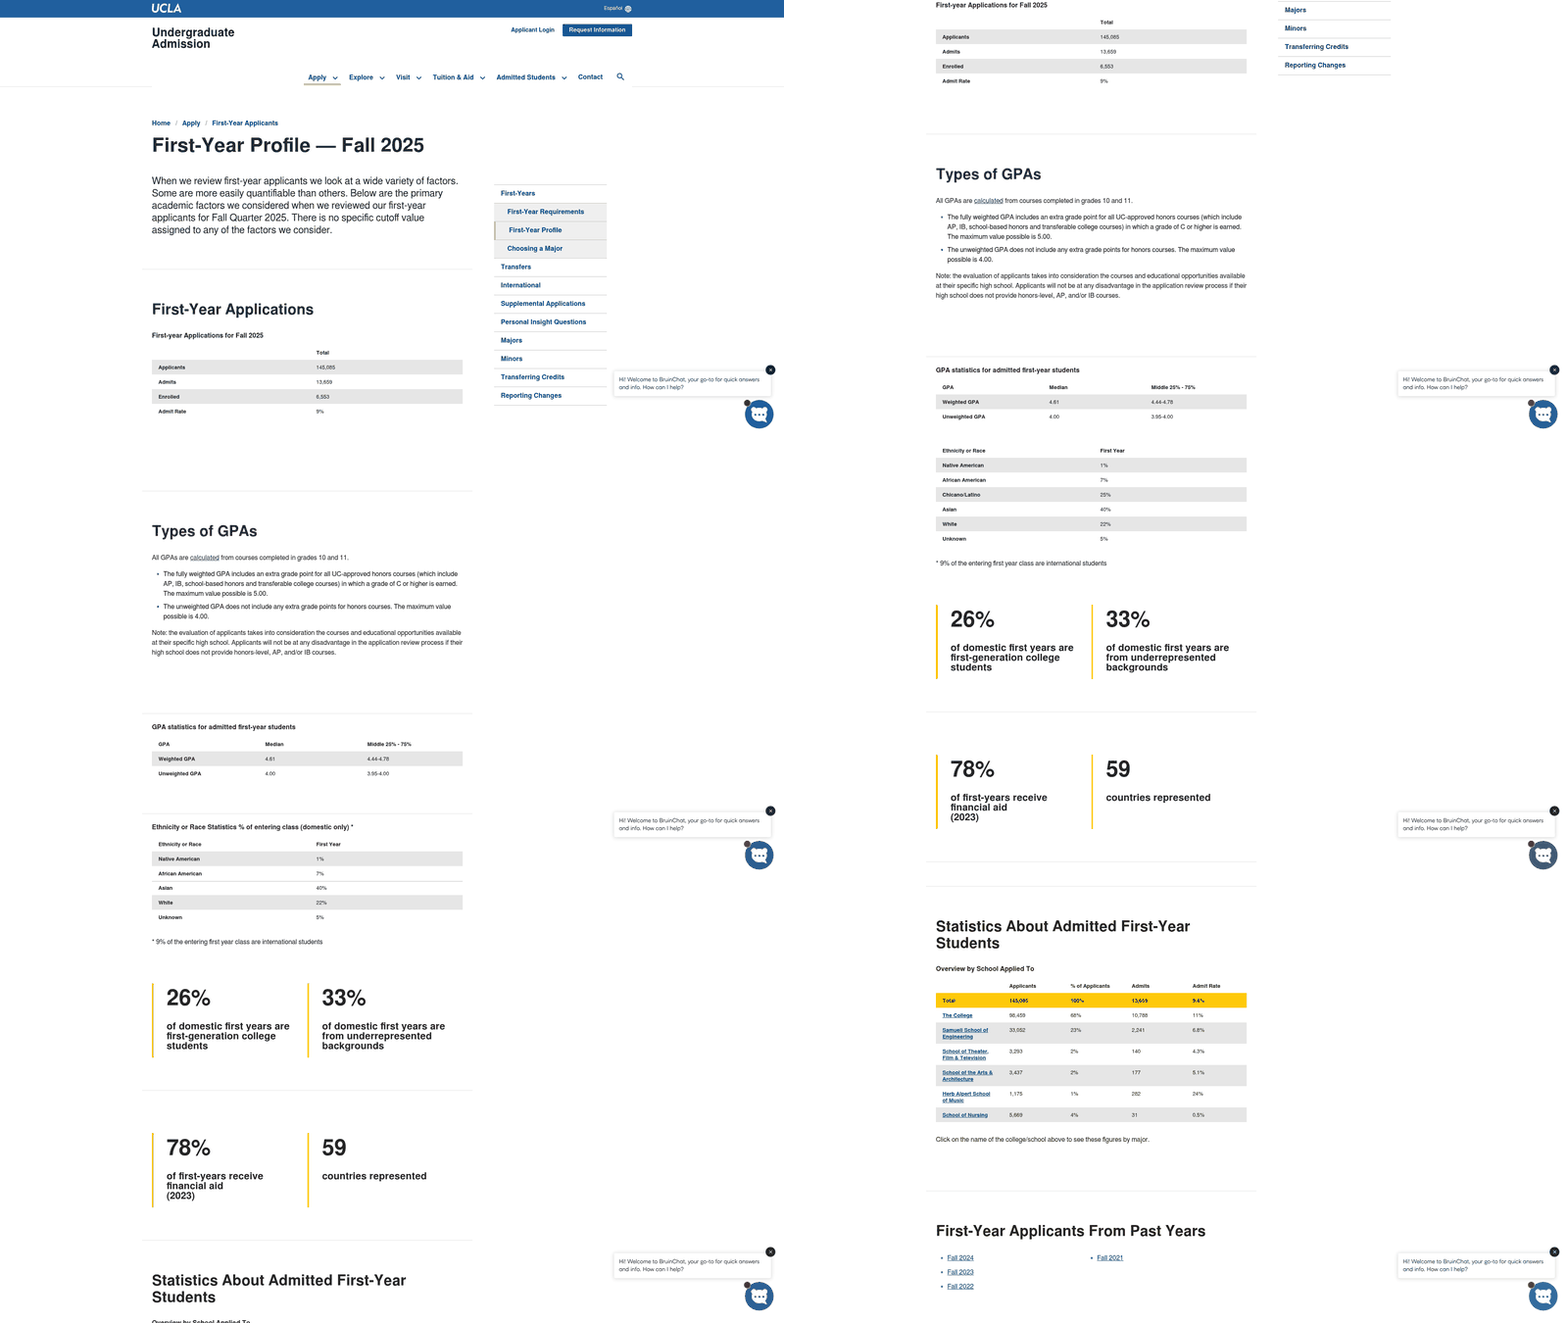
UCLA now sits shoulder to shoulder with the Ivy League in selectivity. The Class of 2029 drew 145,086 applications and admitted 13,659 students, a 9.41% acceptance rate, per Ivy Coach's UCLA data. That's within a few points of several Ivy+ schools. But the headline rate tells you almost nothing about your real odds.
That gap between the posted rate and your actual chances is why we build plans around each student's profile. We do not hand out vague reassurance. No two applicants are alike, so no two strategies are. Our base-plus-bonus model follows the same logic. You pay full fare only when you're satisfied. A few parents have doubled the bonus on their own.
How do UCLA and Ivy+ acceptance rates compare?
Here's the snapshot. Difficulty reflects selectivity and applicant-pool size, not rate alone.
| School | Recent acceptance rate | Testing policy | Early vs. Regular | Difficulty |
|---|---|---|---|---|
| UCLA | 9.41% (Class of 2029) | Test-blind | No early option | High |
| Yale | Low single digits | Test-required | ED/EA available | Very High |
| Columbia | Low single digits | Test-optional reversal | ED available | Very High |
| Harvard | Low single digits | Test-required | REA available | Very High |
| Stanford (Ivy+) | Low single digits | Test-required | REA available | Very High |
| MIT (Ivy+) | Low single digits | Test-required | EA available | Very High |
Rates draw from Collegewise's UCLA breakdown, PrepMaven's peer comparison, and College Raptor's selectivity index.
One split matters more than any number in that table: UCLA offers no early action or early decision, so every applicant runs the regular timeline. At most Ivy+ schools, applying early moves your odds in a measurable way. So the same student needs a different playbook at each school.
Which admissions-support option fits your odds?
Your choices run from free and unguided to fully managed. The trade is always personalization against cost and predictability.
| Option | Key strength | What you give up |
|---|---|---|
| DIY | Free, full control | No expert feedback or personalized strategy |
| Online calculators (e.g., U.S. News tool) | Instant rough estimate | Zero personalization |
| Boutique firms | High personalization | Premium flat fees, paid regardless of result |
| Large chains | Scale and structure | Less individualized attention per student |
| Endurable Education | Base + bonus tied to your satisfaction, 65%+ admitted to Top 10 + Ivy | Requires early, committed planning |
Key takeaways before the deep dive
- The 9% headline is a trap. UCLA's real odds vary by residency, major, and profile strength.
- Testing philosophy splits the two groups. UCLA is test-blind and leans hard on GPA and coursework; most Ivy+ schools weigh scores heavily. That changes what you optimize.
- UCLA may be stabilizing near 9% rather than falling further. Applications dipped in two of the last few cycles, which matters if you're pricing this year's odds.
- Flat-fee consulting charges the same whether you get in or not. Our base-plus-bonus structure ties our upside to yours.
Seven things worth fixing in your head first
- UCLA's newest admit rate rivals Ivy+ selectivity, but the public headline is not a personal prediction.
- UCLA's real odds vary dramatically by program, so a single university-wide figure misrepresents almost every individual applicant.
- UCLA ignores the SAT and ACT; most Ivy+ schools still use scores as a meaningful signal.
- UCLA runs one regular timeline; many Ivy+ schools add a separate strategic question around early rounds.
- Institutional demand drives selectivity, so yield matters when you're reading why some schools admit so few.
- School size and public-versus-private status both shape how acceptance rates behave, which is why peer comparisons need context.
- Recent UCLA patterns suggest you should model stabilization as one scenario, not assume endless decline.
We break down each metric and how to model your own odds against it in the sections ahead.
Why one acceptance rate can't predict your odds
Raw acceptance rates lie to you. A single published rate treats every applicant as interchangeable, flattening residency, intended major, and timing into one figure that fits no real student. Data-driven admissions consulting exists to swap that number for a personal one, built from the variables that actually move your chances.
That's how we build each plan. We work with inputs we can measure and influence, not a headline rate that was never about you. The question isn't whether a school is "hard" in the abstract. It's whether your specific profile is aimed at the right mix of programs, rounds, and narratives.
Why do raw acceptance rates mislead families?
Selectivity is driven by demand, not by how hard your application is to admit. A study of 1,039 U.S. universities found yield rate has a strong negative relationship with acceptance rate. High-demand schools post low rates regardless of your fit.
That same analysis surfaces something most families have backward: larger institutions generally show higher acceptance rates, and public universities behave differently from privates on the yield-selectivity curve. So a single percentage tells you nothing until you segment it.
| Signal | What the headline rate hides | What we help you weigh |
|---|---|---|
| Residency | In-state vs out-of-state pools held to different standards | Your residency pool, not the blended rate |
| Application round | Early and regular rounds held to different standards | Early vs regular timing as a distinct factor |
| Applicant volume | High-demand schools post low rates by default | Demand weighed against your own profile |
Which decisions actually move your odds?
The biggest lever is often behavioral, not academic. Scholaro's selectivity analysis points to a persistent access gap, where many qualified students never apply to schools they'd be competitive at. The application gap can outrun the affordability gap. Fixing where you apply and how complete each application is moves your realized odds more than another point of GPA polish.
At private schools, the round you pick can matter, because it changes both the competitive pool and the institutional priorities in play. At schools without an early option, timing can't rescue a weak fit or a poorly chosen major.
Testing policy shifts the math too. A test-blind campus loads more weight onto transcript strength, course rigor, essays, activities, and context. A test-required campus can use scores to separate applicants who otherwise look identical. Treating both systems as the same is one of the fastest ways to misread your odds.
Who benefits most from transparent odds?
First-generation and low-income applicants often gain the most, because their odds are suppressed by underapplication, not ability. When we build a plan around your real strengths and targets, the question stops being "are we good enough" and becomes "where does our effort pay off." That's a far better use of a stressful senior year. Our experience earns its keep at the selective tier, where segmenting the numbers and applying strategically make the biggest difference.
What UCLA's 9% actually hides
UCLA's headline reads like an Ivy clone, and that framing is the trap. A single university-wide rate says little about your odds, because it blends every applicant pool into one blurry average. That average is where most consulting stops and where honest odds modeling should start.
We build each plan around a student's real profile and target programs, not the posted rate. To do that, you have to break UCLA's number into the pieces that move it. Three matter most: residency, major, and profile quality against a rising academic floor.
Residency flips the odds you'd expect
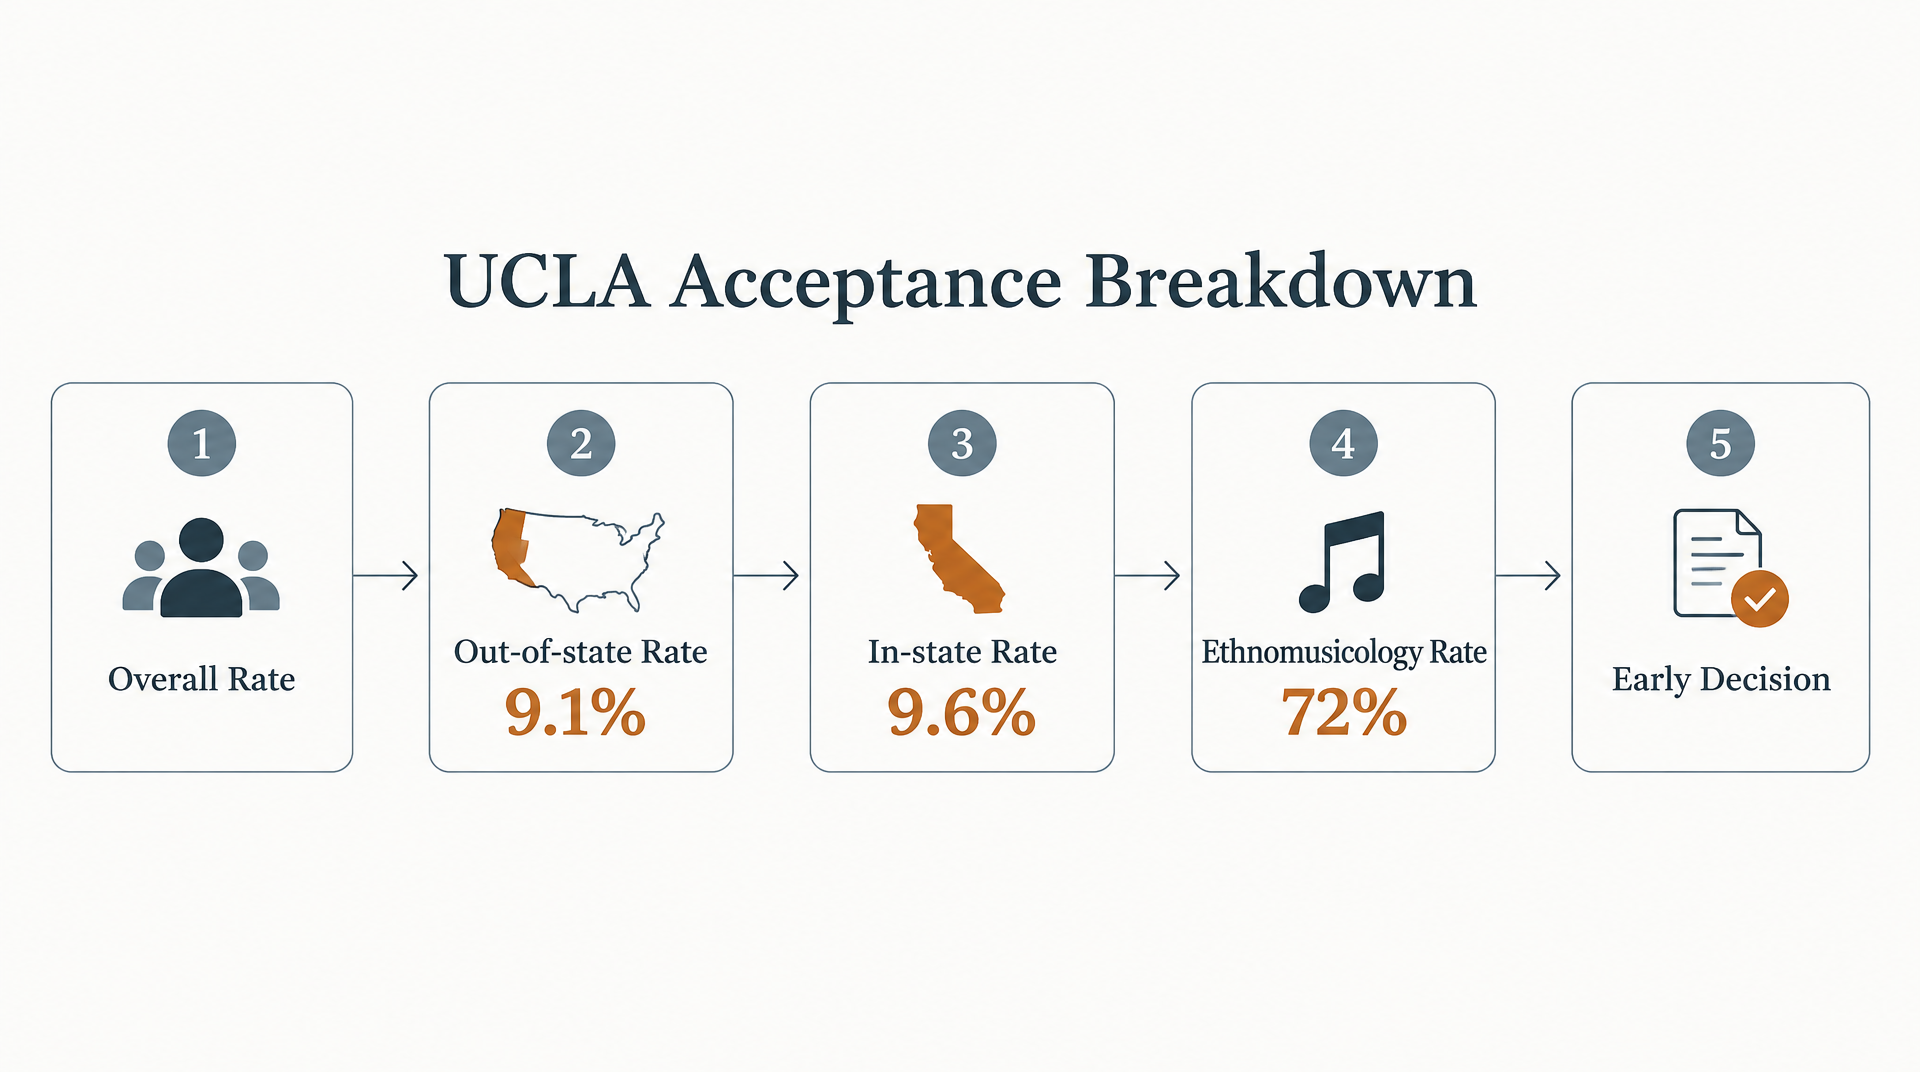
Here's the counterintuitive part. UCLA's out-of-state rate (9.1%) runs slightly below its in-state rate (9.6%), yet it's harder to get in from out of state, Collegewise reports. Out-of-state admits have to perform at or above in-state levels, so the higher headline masks a tougher bar. Read that residency rate literally and you'll misprice a non-California applicant's real chance.
The major you pick can swing odds by 70 points
Program choice is the single largest lever a student can pull. Look at the spread across UCLA's schools and majors:
| Program | Approx. acceptance rate |
|---|---|
| Theater, Film & Television | 1.1%–3% |
| College of Letters & Science | 10% |
| Ethnomusicology | 72% |
Nursing and Ethnomusicology figures come from Collegewise's major breakdown; the individual-school rates are from Top Tier Admissions. The gap between the toughest and softest program runs past 70 percentage points. Same university, wildly different math. And worth knowing: switching into an impacted major after enrollment is rarely simple, so the program you name on the application often locks in your path for years. A strategy built around your specific programs and profile does far more than one aimed at a headline average.
The academic floor keeps climbing
UCLA is test-blind, so SAT and ACT scores do nothing here, US News confirms. GPA carries the load, and the load gets heavier every cycle. The published figures show a rising academic bar, and the UC GPA is not your high school GPA. One caution worth stating plainly: the UC GPA is not your high school GPA. California residents need a 3.0 minimum, non-residents a 3.4, and those are floors, not targets.
One more input. Ivy Coach notes UCLA's rate has ticked up three years running while applications dipped in two of the last cycles, hinting that interest may be leveling off rather than collapsing. So the rate may be stabilizing rather than spiraling toward Ivy territory. PrepMaven confirms UCLA runs no early round, so calendar tactics are off the table. The odds come from fit, program, and profile alone.
How the Ivy+ numbers actually stack up
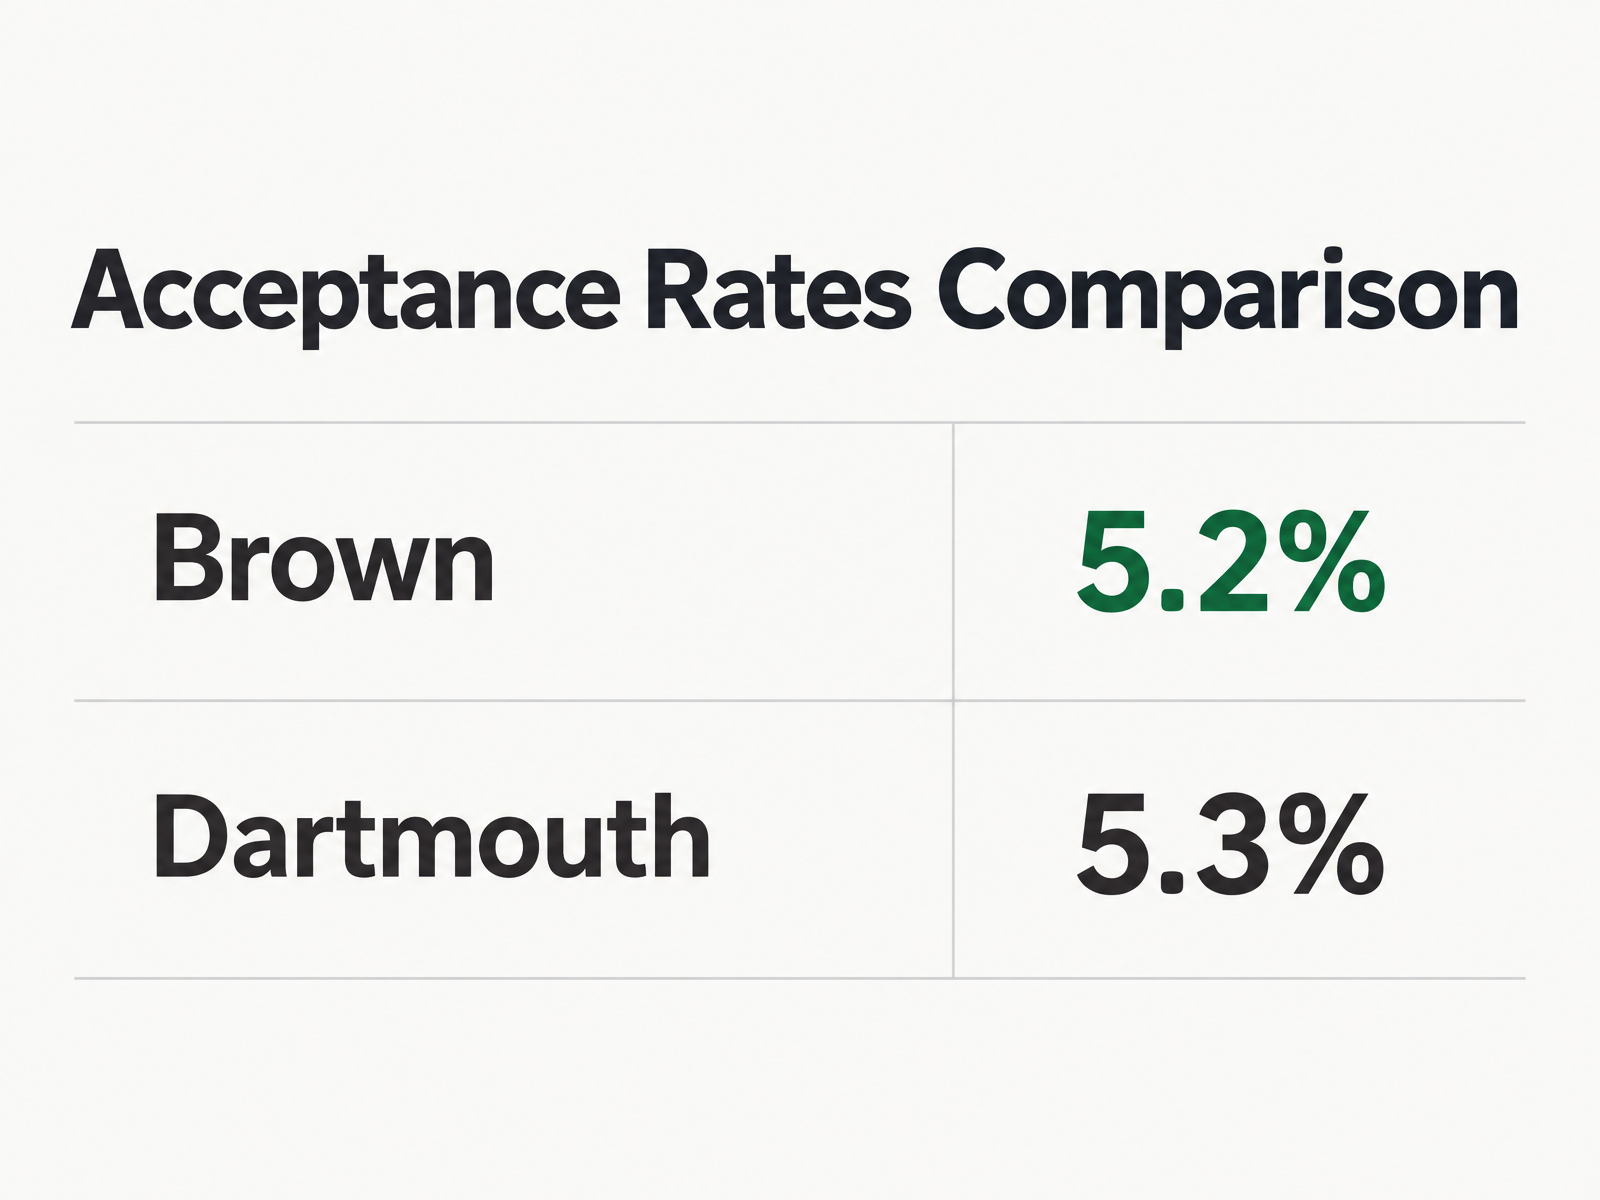
Look past the headline and the Ivy League clusters tighter than most families expect. Brown landed at 5.2% and Dartmouth at 5.3% for the Class of 2028, per PrepMaven's tracking, within a fraction of a point of each other. When several schools cluster that closely, the posted rate stops being a useful sorting tool. That's exactly where consulting has to add value, because a family staring at near-identical numbers has no way to price their own odds.
Our work starts where the public rankings end: separating the schools where a profile is genuinely competitive from the ones where the gap is too wide to justify the effort. Selective-school strategy isn't "apply to famous places." It's deciding which hard odds are worth taking and which are statistical noise for your particular application.
How do Ivy+ acceptance rates actually compare?
Here's the tier laid out with the pieces that move an odds model.
| School | Acceptance rate | Applicants | Note |
|---|---|---|---|
| MIT | Low single digits | 28,232 | Class of 2028 |
| Duke | Low single digits | 54,151 | Class of 2028 |
| Brown | 5.2% | 48,904 | Class of 2028 |
| Dartmouth | 5.3% | 31,657 | Class of 2028 |
Two schools with nearly identical rates can reward very different profiles. The rate alone tells you nothing about which environment fits a given student's strengths or goals. That's why we build plans around each student's profile instead of treating equally selective schools as equal bets.
Why does application timing affect your odds?
Round of application is a variable, not a footnote. Admissions timelines differ sharply school to school, and the round you apply in can shift the pool you compete against.
Some public flagships break the pattern by offering no early decision, so every applicant runs the same regular timeline. Elsewhere, the strategic question is whether a binding or restrictive early plan matches the student's priorities, risk tolerance, and school list. An odds tool worth trusting has to model when you apply, not just how strong you look.
What yield rate reveals about your odds
Acceptance rate alone is a weak signal. Yield explains part of the machinery behind it: when admitted students are likely to enroll, a college can admit fewer people and still fill the class.
For you, that means demonstrated interest and fit feed the same loop that keeps these rates low. A profile that reads as a genuine match can matter more than a marginal credential bump. That's the difference we build each plan around.
Choosing the right support: Endurable Education vs DIY vs other consulting services
Three paths sit in front of most families: go it alone, hire a traditional firm, or work with an outcome-based service. Each one prices your risk differently, and that pricing is where the choice actually gets made.
DIY costs almost nothing upfront. You piece together your own timeline, essay feedback, and school list from public sources. That works until you hit judgment calls with no clear answer, like whether to apply early decision or how to frame a gap in your transcript. You absorb every one of those calls, which means you carry all the risk.
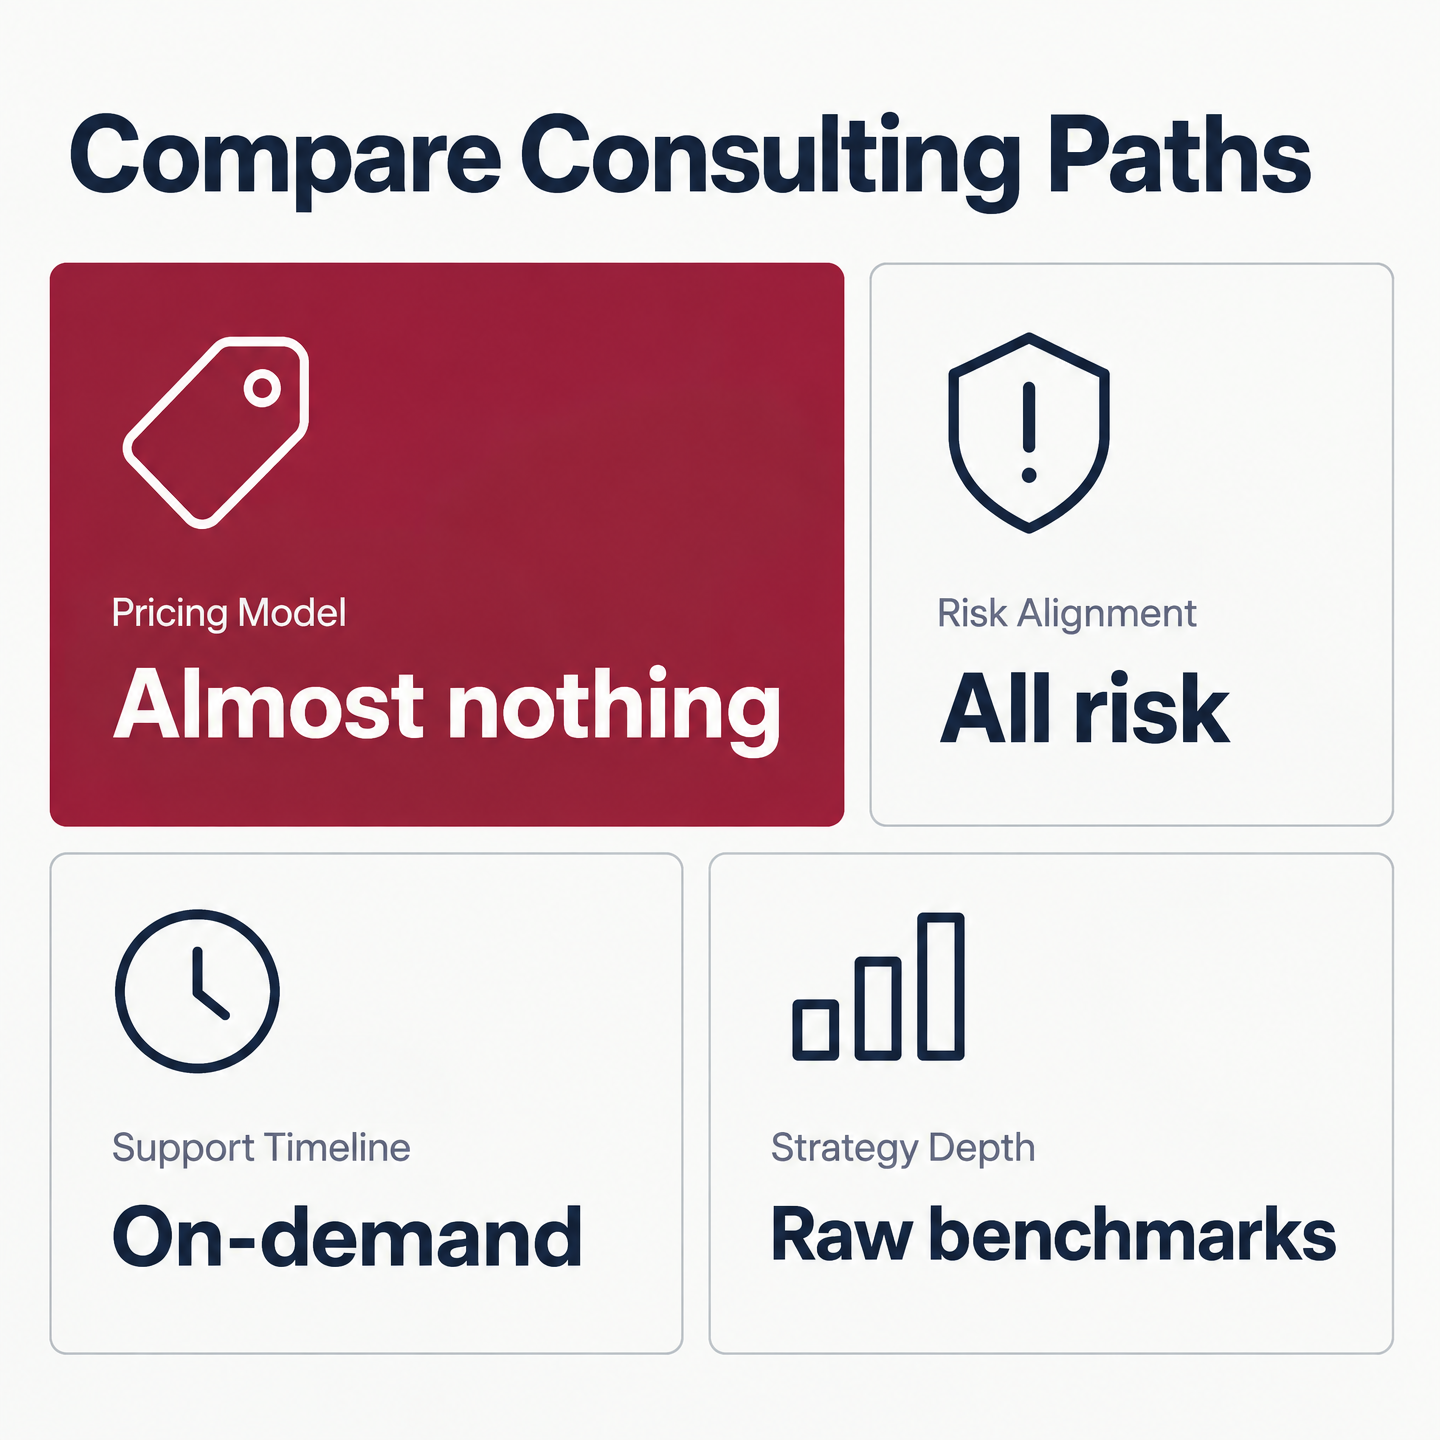
Most traditional firms flip that. They charge a flat retainer or hourly package before a single decision letter arrives. You pay the same whether the plan works or not.
Our model splits the difference. We charge a base fee, then a satisfaction-based bonus, so families aren't asked to treat promises and outcomes as the same thing. The relationship stays aligned from the first planning conversation through the final application review.
How does each option handle your real odds?
| Criteria | DIY resources | Traditional consulting | Our approach |
|---|---|---|---|
| Cost structure | Free to low, upfront | Flat retainer, upfront | Base + satisfaction bonus |
| Personalization | Self-directed | Advisor-led templates | Profile-specific plan |
| Strategy depth | Raw score lookups | Benchmarking | Panel-reviewed custom plan |
| Support timeline | On-demand, unstructured | Fixed package window | Multi-year, milestone-based |
| Risk alignment | You carry it all | Firm carries none | Shared |
The clearest gap sits in the strategy column. DIY gets you raw benchmarks. Many firms stop at comparing your scores against last year's admitted class. We build a plan around the student's strengths and goals, and every application and essay is reviewed by at least two members of our team before it goes out.
When is DIY actually the right call?
Skip paid help if your target schools have acceptance rates above 40% and your profile already clears their academic floor. The data doesn't justify the spend there.
Paid support earns its keep when you're aiming at single-digit-rate schools, where small profile decisions swing your odds. If you want a fuller breakdown of consultant types and the tradeoff each one forces, our comparison of the five types lays it out.
References
[1] UCLA Class of 2030 Admissions Statistics | Ivy Coach - https://www.ivycoach.com/the-ivy-coach-blog/college-admissions/ucla-admissions-statistics/
[2] UCLA Acceptance Rates (2026) - Collegewise - https://collegewise.com/blog/ucla-acceptance-rates
[4] University of California Los Angeles - Acceptance Rate and Statistics - https://prepmaven.com/blog/researching-schools/ucla-acceptance-rates/
[5] UCLA Acceptance Rates: Decoding the Data - Top Tier Admissions - https://toptieradmissions.com/ucla-acceptance-rates-decoding-the-data/
[6] [PDF] Yield Rates and Institutional Selectivity - SSRN - https://papers.ssrn.com/sol3/Delivery.cfm/6833958.pdf?abstractid=6833958&mirid=1
[7] What Rising Selectivity Means for Access to U.S. Universities - Scholaro - https://www.scholaro.com/db/News/university-selectivity-trends-349
[8] Rankings | Most selective colleges in the U.S. - Acceptance and yield rates - https://www.collegeraptor.com/college-rankings/details/Selectivity/
Questions People Ask
Should I still submit SAT scores to UCLA if I have a strong result?
No. UCLA will not use SAT or ACT results in admission review, even if they strengthen your overall academic story. Put that effort into the parts UCLA actually reads: course rigor, grades, activities, essays, and the way your application explains your context. Save score-reporting decisions for schools that still consider testing.
Can I list an easier major to boost my UCLA odds, then switch later?
Be careful. UCLA's program-level differences are real, but choosing a major you do not want can create problems after admission. Capacity-limited departments are not always easy to enter later, so the smarter strategy is to choose a target that fits both your academic record and your actual goals.
What UC GPA do I actually need to be competitive at UCLA?
The published minimum is only an eligibility threshold, not a realistic target for a highly selective applicant. UCLA evaluates the UC-calculated version of GPA, which may differ from the number printed on your transcript. For a serious UCLA strategy, treat rigor and sustained performance as central evidence rather than asking for one magic cutoff.
Is it easier to get into UCLA as an out-of-state applicant?
Not in practical terms. The published residency rates can look close, but the review standard for non-California applicants is still demanding. Out-of-state families should model UCLA as a reach unless the student's academic record and intended program make the fit especially strong.
Since UCLA has no early round, does applying early anywhere still matter?
Yes, but only for schools that actually offer an early plan. UCLA's timeline does not give you that lever, while many private selective colleges do. Your application calendar should therefore be school-specific rather than built around one universal “early is better” rule.
When is it worth paying for admissions consulting instead of going DIY?
DIY is reasonable when your list is mostly accessible and your profile is comfortably above each school's academic expectations. Consulting becomes more valuable when the list includes highly selective colleges, unclear strategic tradeoffs, or essays that need to differentiate a strong applicant from thousands of similar ones. Endurable Education is built for families who want that judgment applied to the full plan, not just a final proofreading pass.